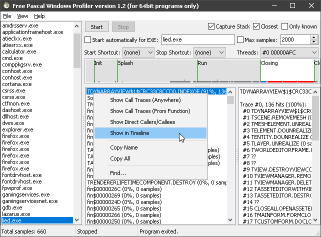
 Free Pascal
Windows Profiler (FPWProf) is a simple statistical
profiler written in Free Pascal and Lazarus and mainly meant
to be used for profiling programs written in Free Pascal under
Windows (though it can also be used with some C programs compiled
using MinGW). It supports 32bit and 64bit executables with either
STABS or DWARFv2 debug information.
I wrote this tool mainly because i couldn't find a working statistical profiler (...or even not, though i prefer statistical profilers as unlike what the Wikipedia article above claims, i find them way more accurate and useful in practice than instrumentation-based profiles) for Windows that worked with Free Pascal executables and instead had to boot into Linux so i can use perf - an annoying process to say the least.
FPWProf isn't as advanced as perf - or most statistical profilers for that matter - as it only counts the number of samples per function and only supports DWARF or STABS (no support for, e.g. PDB). Still it is useful enough to have a clear view where in a program most of the time is spent.
As of version 1.1 FPWProf can capture the call stack, which enables a much better view of how a heavily called function is called from. In version 1.2 a timeline was introduced to help focus on parts of a program's run time.
Downloads and links:
Older versions:
This is an open source program licensed under the zlib license (but keep in mind this note).
Kostas Michalopoulos